


|
Data
Archiving
Box
and Analysing System
Main parameters for archiving:
- Load on wings
- Load of several body frame points
- Load on landing gears (during take-off and landing)
- Engine management data
- On-board video recording of flight maneuvers and pilot
activity in high loaded situations
- 3 axis acceleration measurement
- GPS position, absolute speed, altitude and date-time
registration
- Aircraft air relative speed
Sampling rate of analog
parameters are 1-10 samples/second
Sampling rate of video capture
is 10-30 frames/second
The Data Archiving Box can store
flight data during the whole lifetime of the airplane
Main components and
sensors of
the On-board Data Archiving Box
- 32bit embedded microprocessor
- Redundant non-volatile memory
- Video camera and Mpeg4 encoder for video stream
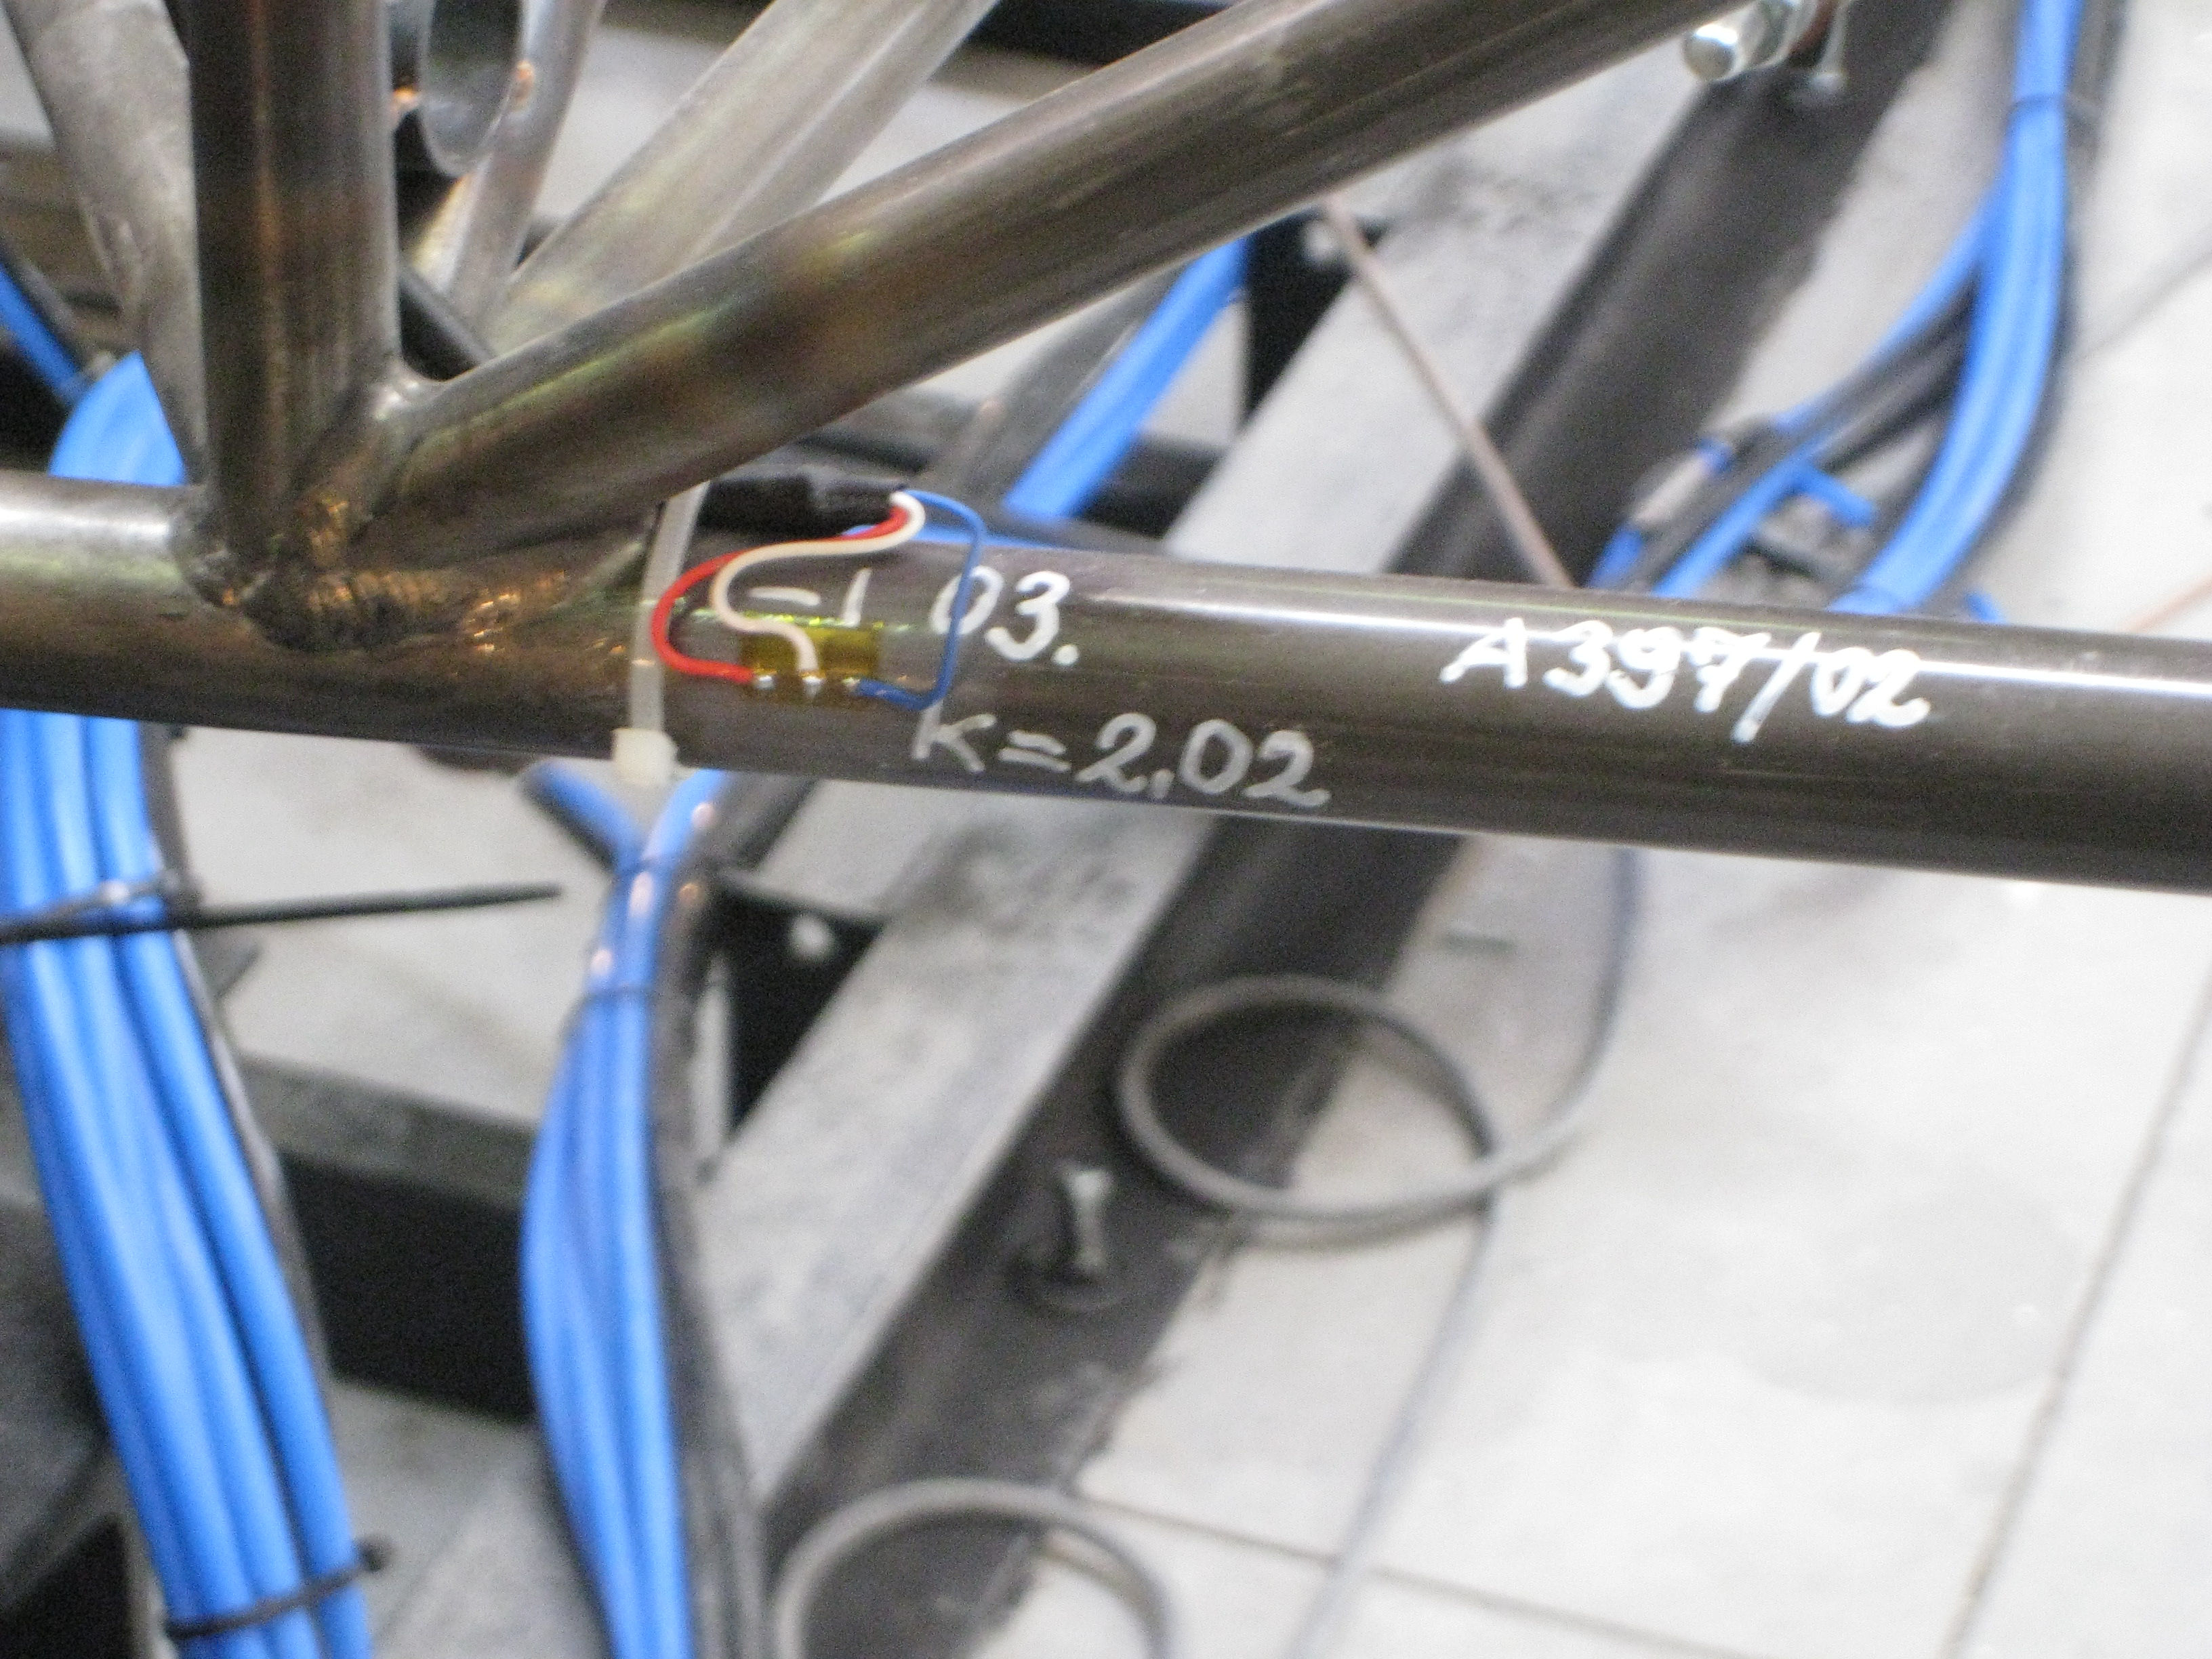
- Force measuring stain-gauges sensors up to 16 pieces
- 3 axis accelerometer with range up to 12g
- Data interface for many type of engine management computers
- GPS module
- Pitot tube for air speed measurement
- On-board autonomy for detecting high loaded periods
- High frequency sampling rate during high loaded periods
- Weight is less than 500 gr.
Data Analysing System
- Off-line data download through secure wireless protocol
- Internet based visualization using built-in web server
module
- Centralized data analysis for airplane manufacturers and
servicing partner companies
2.
Nov. 2015
|
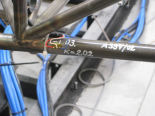
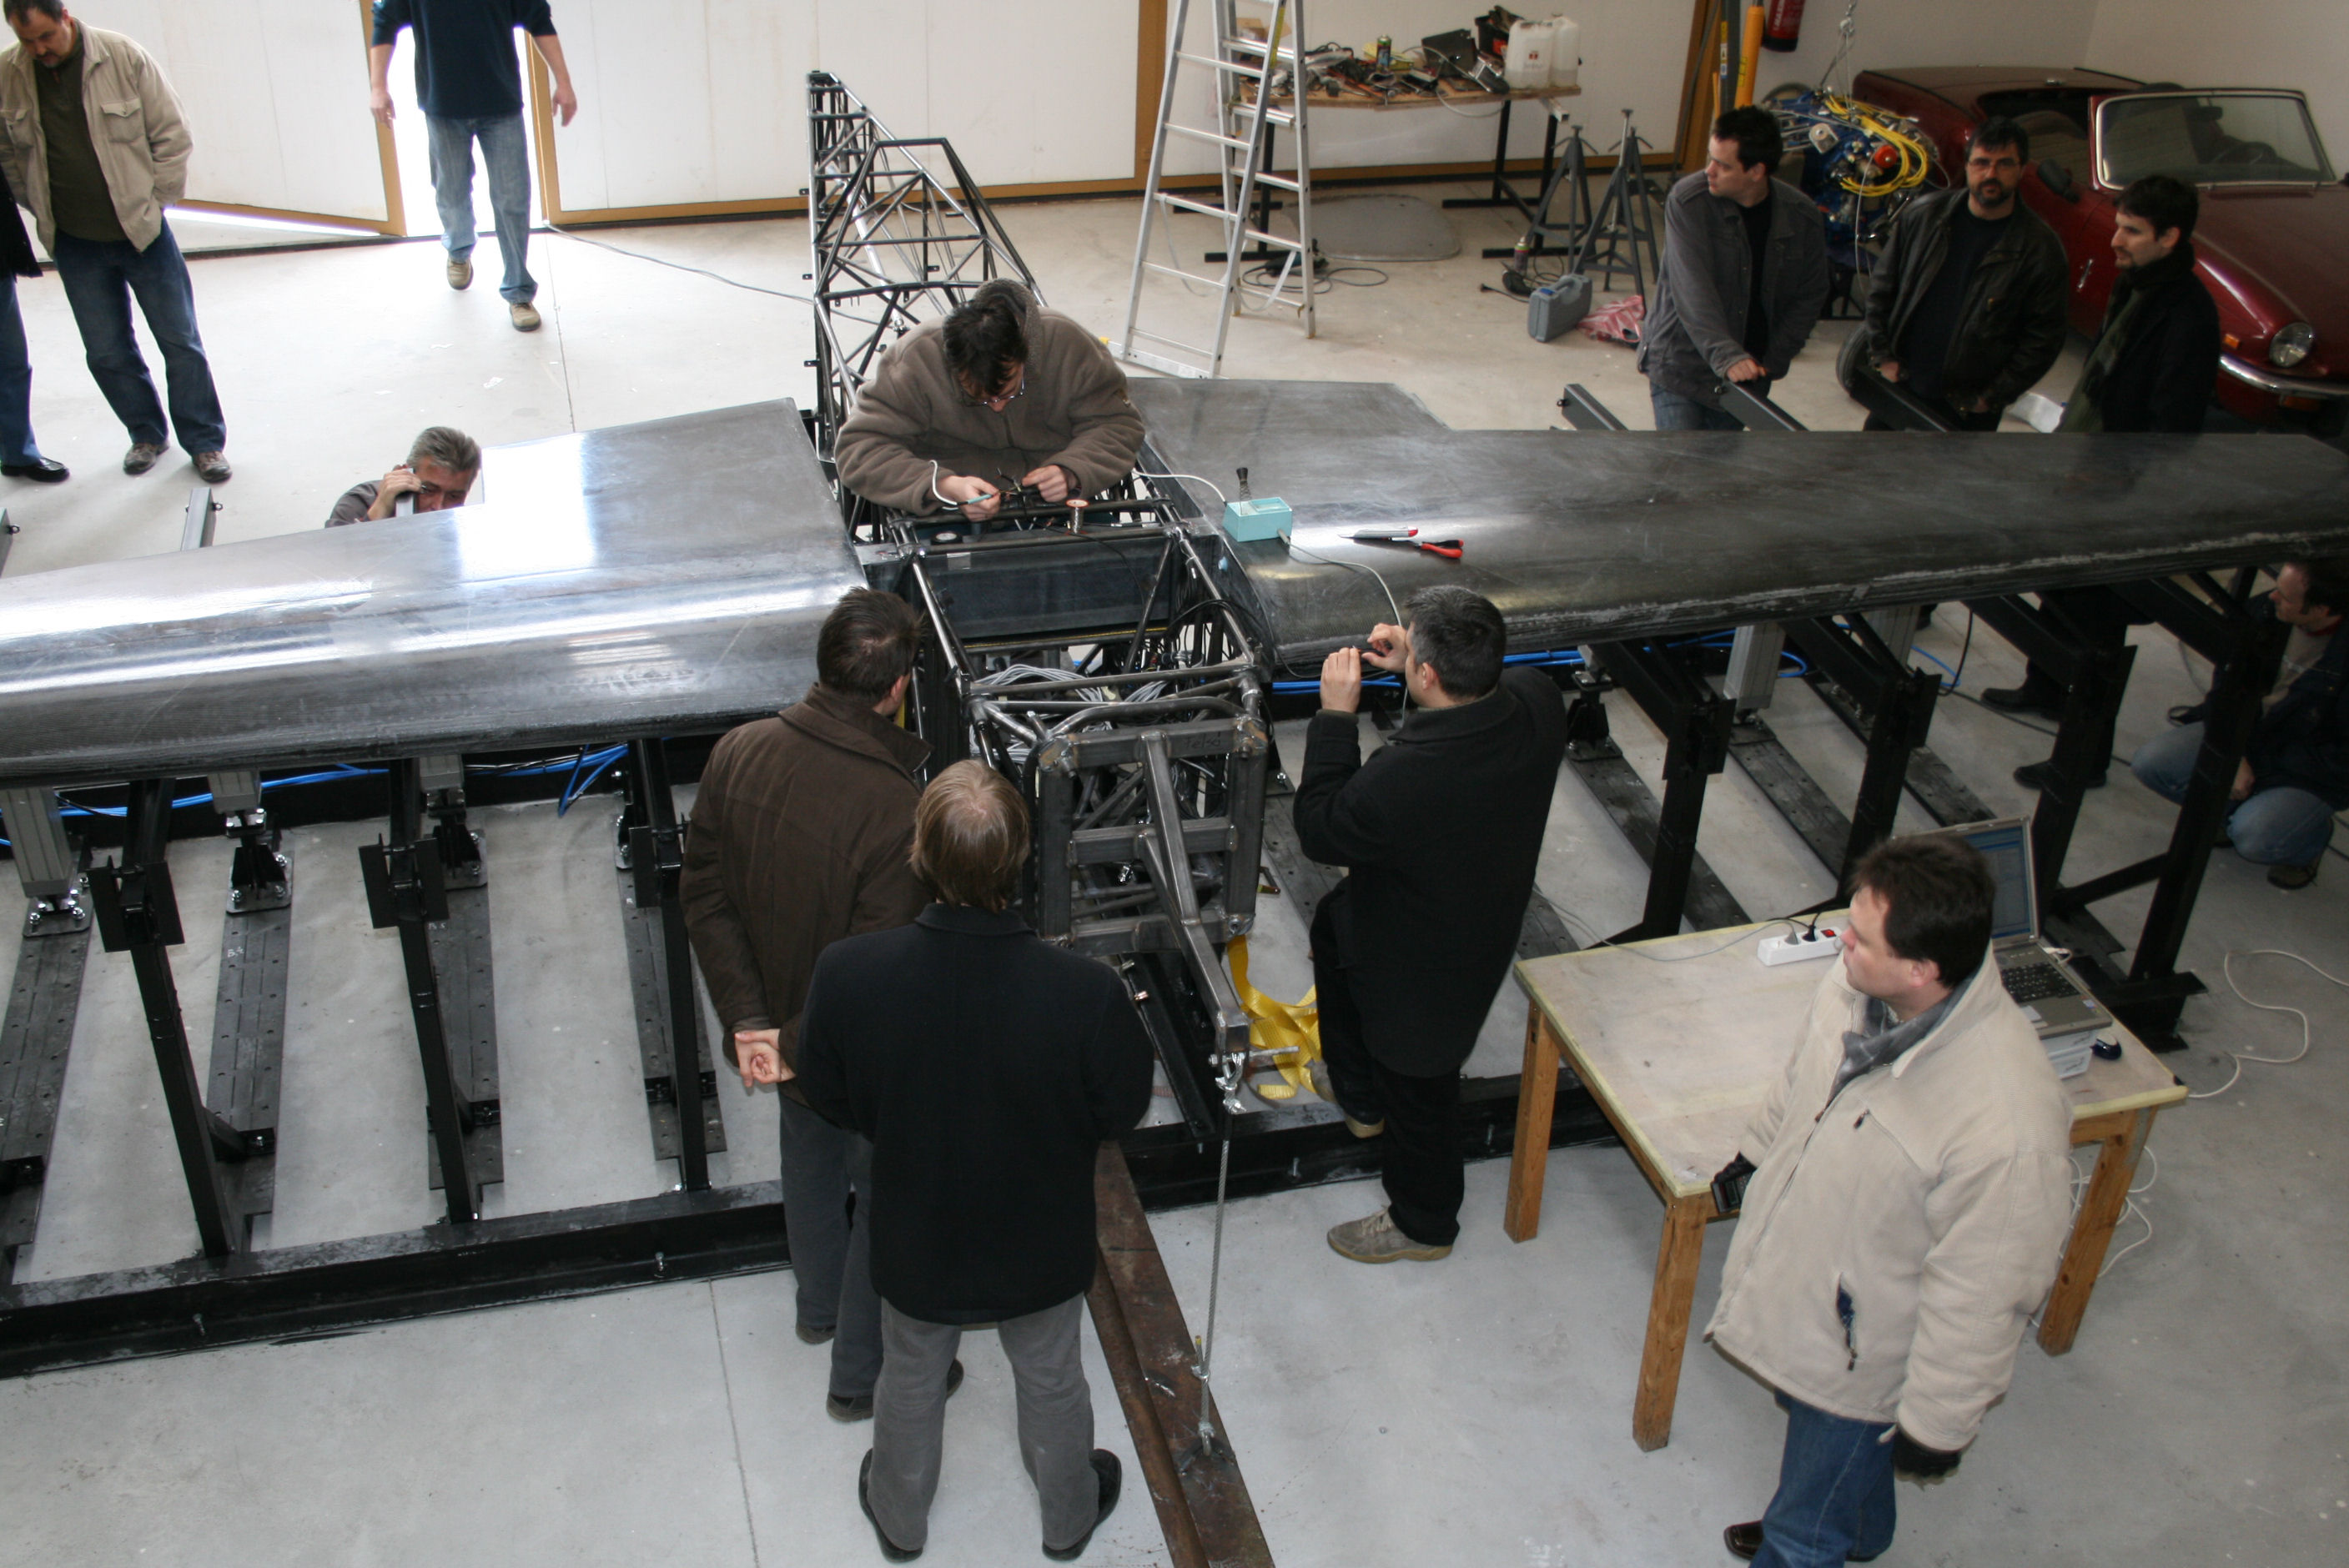
Stain
gauges monting on Racer 540 airplain
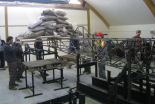
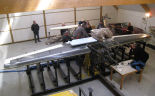
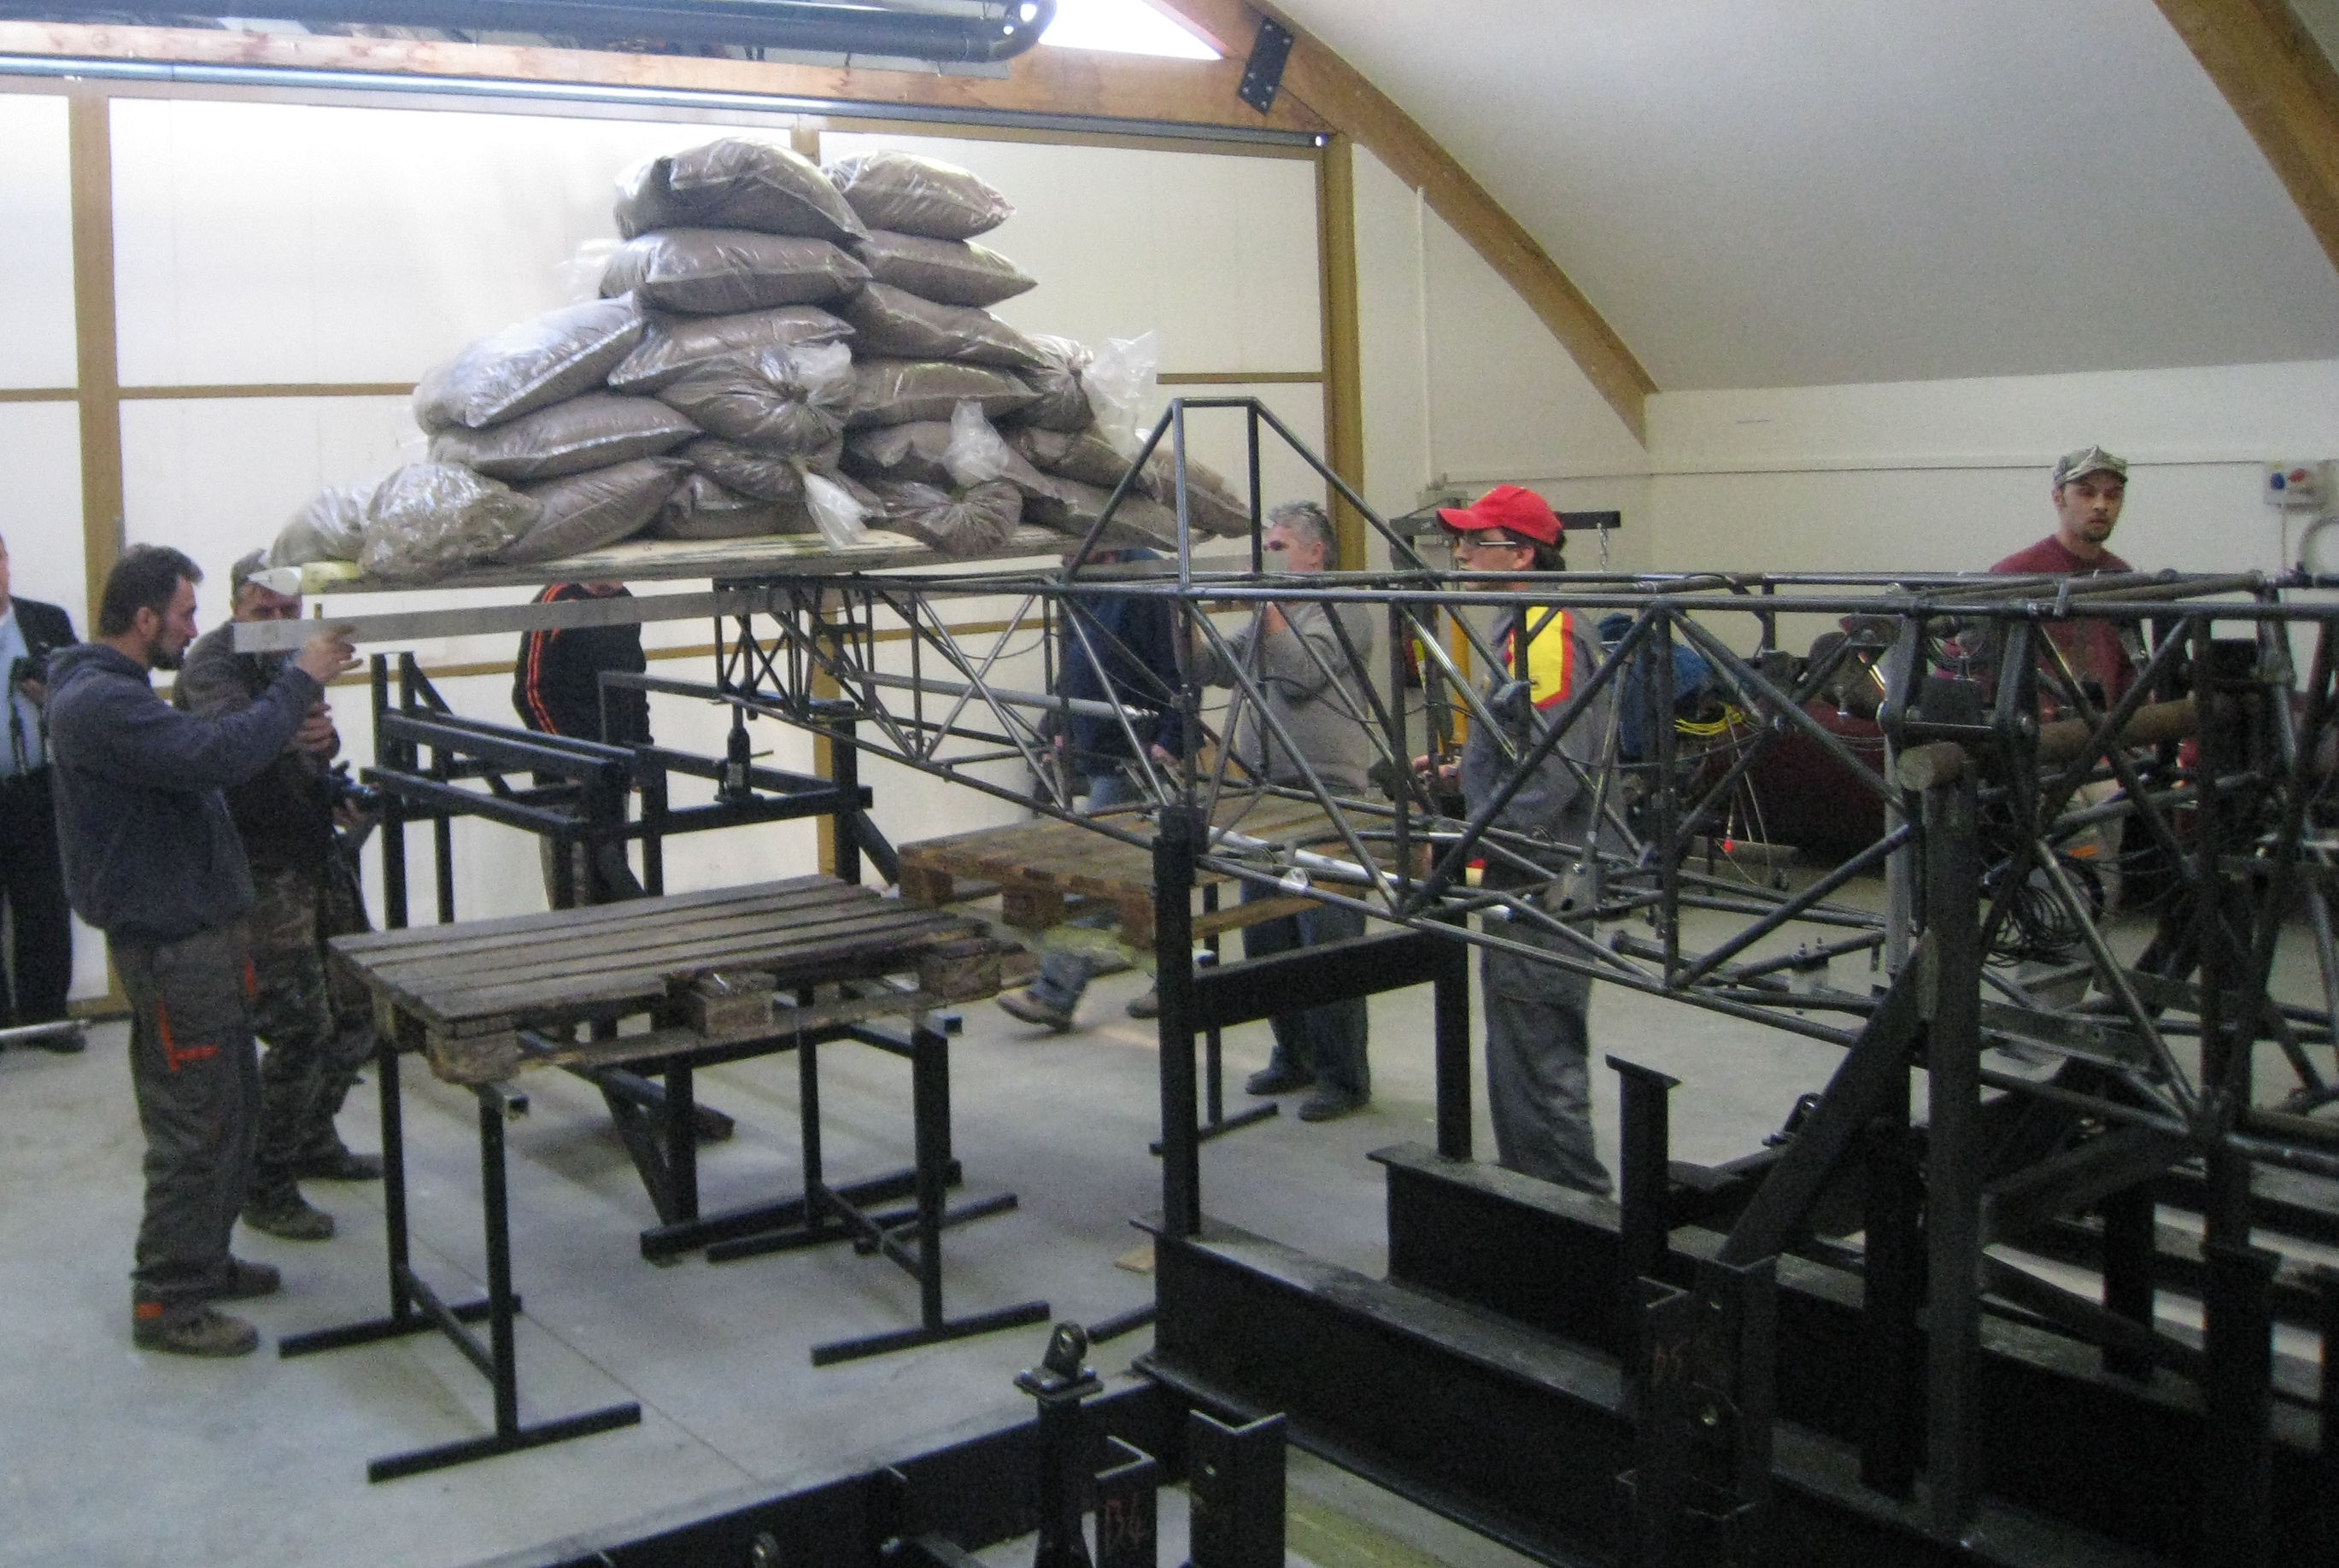
Test Load of the Airplane Structure
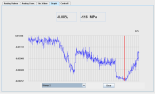
Graphical
User
Interface for load visualisation
|